


Web Hosting Support

Server / Cloud Support
Windows Server Support

Server Security Solutions
DevOps
Solutions
----------------------------
Globusa Media Group, an independent full-service direct marketing agency, helps businesses reach and engage their target consumers.
----------------------------
Meet University helps students search, discover and apply to desired university with ease from its wide university listings. All this with single a form.
----------------------------
Motisons Group aims to provide excellent jewellery while driving growth with enormous business values by maximizing opportunities and human potential.
----------------------------
Twinfold Capital is helping thousands of businesses with their financing needs around the nation. They specialize in funding for small businesses.
----------------------------
The Smart Crypto Solution is a service-based organization which develops crypto and blockchain-related products and platforms.
----------------------------
Rational Technologies provides software, web, mobile, ecommerce, and enterprise designing solutions to companies worldwide.
----------------------------
Rashi Ratan Bhagya sources genuine gemstones from the most trustworthy sources around the world and sells them to its customers.
----------------------------
Pay Master Coin is a new digital cryptocurrency that allows you to send money to anyone, anywhere in the world, instantly.


Cloud Management
Databases Management

Containers & Orchestration

CI / CD Management

Security Management

Server Monitoring

Infrastructure Management

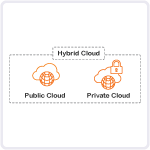
Cloud Computing Management

Email Server Management

Server Control Panel Management

Ecommerce Server Management

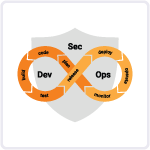
Manage DevOps Solutions


How to Install cPanel on CentOS 7
Installing cPanel on CentOS 7 can make the process of hosting and managing websites on your

How to install and Use Imunify360 on cPanel
Cybersecurity is a critical concern for anyone running a website today, particularly with the increasing prevalence
How to Configure two-factor authentication for cPanel
Securing access to control panels is necessary in web hosting and server management. Two-factor authentication (2FA)


I was overwhelmed by server management tasks until I found Supportfly. Their comprehensive server management services have been a game-changer for us. From the initial setup to ongoing support, they have handled everything seamlessly. Their team's deep knowledge of server technologies and industry best practices is evident in their work. They have helped us scale our infrastructure efficiently and provided valuable guidance along the way. I highly recommend their services to fellow entrepreneurs.
Everett Spier